
There were hurricanes, fires, pandemics, and run-of-the-mill technical difficulties … and we’re talking about DARM, not the apocalypse. While many others took rigorous notes to create sweeping summaries of the conference and its sessions, RevPARTY took note of where we could add value. In this series, we cover topics that may have been missed, concepts that are hard to cover so briefly, and discuss the ideas we wished we had but time did not allow.
Where We Left It At DARM

As happens more often than we’d like, we ran out of time during the RevPAR Discussion Panel at this year’s Vacation Rental Data and Revenue Management Conference. We were able to cover many of the advantages and minutia of using RevPAR as a key metric in our industry:
It can be customized to many needs and perspectives (adjusted, bedrooms, etc.)
It can account for fluctuating inventory levels
It captures the tradeoff between ADR and occupancy
It lends itself to analysis because it treats the collinearity/positive correlation between ADR and occupancy (i.e., in peak season ADR and occupancy both raise at the same time)
Economically it represents the expected value of any room night which is a simple way to make decision making easier (the probability a room night is booked is equivalent to occupancy and the expected reward is ADR, making RevPAR the expected value)
But … I think there’s something you should know about RevPAR that wasn’t covered.
It takes data and revenue management to the next level. It supports other functions that never touch data platforms, pricing models, or the financials. It not only makes for a better revenue manager; it makes for a better vacation rental manager.
It’s the space between RevPAR and Net RevPAR or the distance between actual RevPAR and RevPAR targets.

The Problem with RevPAR Alone
Most commonly RevPAR is utilized by the revenue management team and decision makers to gauge top line revenue, year over year growth, and portfolio performance compared to market. Its great at doing all of those things. However, especially as a portfolio and team grow, it gets more and more difficult to make such generalized metrics useful.
Net RevPAR helps get at this issue but only at a surface level. With Net RevPAR you can evaluate a property or portfolio’s profitability. At the end of the day, this is the number any top-notch vacation rental manager cares about the most. They’re running a business and the goal of the business is to be profitable.
But with only those two numbers, how do vacation rental managers know what to do to get better? Are their costs too high? Do they need more revenue? The answer to both is always “yes.” But how do they do it?
Line Items on a PAR Basis
We all know that the difference between RevPAR and Net RevPAR is all of the associated costs and expenses with renting that room night to a guest. Many, especially larger portfolios, will break down their expenses to a PAR (per available room) Basis to report on and track unit economics for owners and investors. It’s essentially their financial statement divided by room night count (rooms in inventory x nights in period) so that year over year changes are inventory agnostic.
By simply breaking out line items on a PAR Basis, it helps contextualize the impact each item has on Net RevPAR. If MaintenancePAR, UtilityPAR, RentPAR, or any other cost metric is relatively high then it’s an indicator that that component of the business could use a little work; the same as a well-done vacation rental Profit and Loss Statement.
But the more amazing part is the scene it sets as a vacation rental business plays out on a larger stage.
How Did We Miss Targets & How Do We Fix It?
While calculating costs on a PAR basis helps you identify and treat challenges to Net RevPAR and profitability, it doesn’t diagnose challenges to revenue. As a portfolio grows, as a team grows, as there are more markets to manage, and as strategies become more complex and solutions more sophisticated; it gets harder and harder to pinpoint useful and impactful insights. Most short-term rental managers want to know:
Why and how did we miss our targets?
Who was responsible for the miss?
Could it have been prevented?
How do we fix it?
How do we prevent it from happening in the future?
In order to show how anybody could answer these questions and drive results in their business, we’ll breakdown an example with simplified components step by step (I tried to do a full financial breakdown but it’s a bit heavy for a blog post).
Unit Count
First, there needs to be a consistent approach to unit and room night count. Most vacation rental managers simply remove “blocked” (owner blocked, comped stays, property hasn’t onboarded yet, etc.) room nights from their PAR calculations. This gives a really fair and apples to apples view of efficiency and effectiveness. The downside is it doesn’t always explain the financials in totality.
When looking at top line company revenue to analyze cashflows, ROI for investors, or budgeting the absolute amount of money matters. Any discrepancy in actual unit count to forecasted unit count has to be accounted for because if it isn’t there will be missing money from the bank account. Moreover, if you have a property onboarding/launch team or an owner sales team the unit count variance is an indicator of their ability to convert the property pipeline and meet deadlines.
Market Performance vs. Property Performance
Everyone in the vacation rental industry benchmarks their portfolio RevPAR to the market RevPAR. It’s an easy to comprehend metric, its how we benchmark stocks and mutual funds, and it feels good to say, “Our portfolio beat the market by 20%.” But beyond knowing if the portfolio did “good” or “bad” it doesn’t generate any actionable insight.
Vacation rental portfolios have to properly forecast in order to generate actionable insight and begin to understand any miss against targets. There are three key components to RevPAR, ADR, and Occupancy forecasting that are absolutely necessary to diagnose challenges and find solutions to maximizing vacation rental revenue:
Forecasted/expected market performance (Market RevPAR)
Forecasted/expected portfolio performance compared to market (RevPAR Pen)
Forecasted/expected portfolio performance (RevPAR)

The forecast can estimate portfolio performance by assuming it performs at X% compared to market or it can estimate performance compared to market by assuming a certain portfolio performance, but all three components must be included.
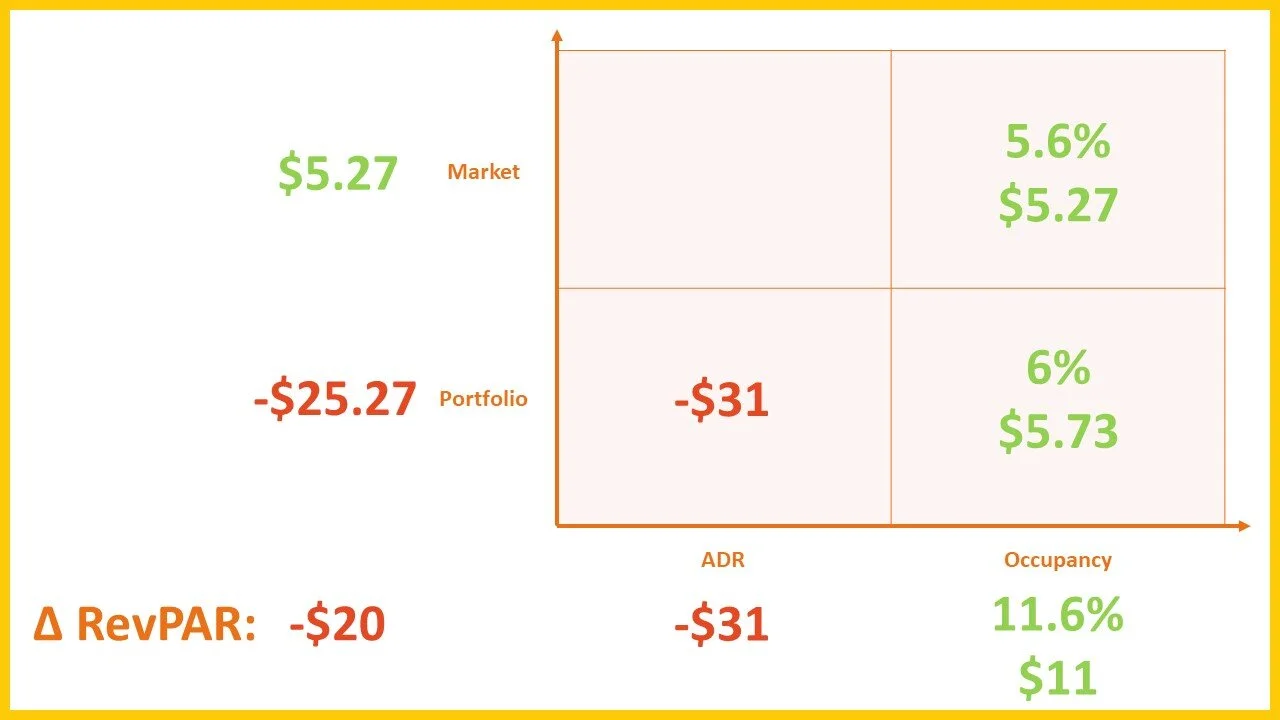
By forecasting this way, property managers can determine if their lack of or excess revenue was due to changes to the market as a whole or due to the performance of the property/portfolio against the market. Any change in Market RevPAR represents changes to the market as a whole while changes to RevPAR Pen signify individual property performance issues.
For example, if the market underperformed by 10% compared to forecast that change would correlate to a drop in actual property RevPAR. Even if the property performed just as well against the market as forecasted, the property RevPAR would be lower because the whole market under-performed.
Additionally, if the property performed 10% worse against the market than expected, even with the market under-performing, if the property had performed as forecasted it would’ve had a higher RevPAR. But, because the property under-performed compared to market in a market that under-performed the negative effects to RevPAR are cumulative. The change in RevPAR Pen accounts for a further drop in the property’s actual RevPAR.
All told, the example property missed its RevPAR projections. Normally, most property managers would say something like, “the market was down,” or, “we messed up.” Unfortunately, those aren’t useful in diagnosing problems and finding solutions. If the vacation rental manager forecasted and compared actuals using the method above, they could say, “We lost $11 in RevPAR to market underperformance which wasn’t preventable … but our property also performed 10% worse than expected so instead of recouping the market loss we gave up another $9 in RevPAR. We need to fix that.”
Diving Deeper and Diagnosing
Forecasting RevPAR and analyzing the results using this method is a great way to understand a portfolio’s overall performance but diving deeper really helps you diagnose underlying challenges.
The first and most obvious step is to break RevPAR into its components: ADR and occupancy. Using the exact same method as above, ADR and occupancy changes can be attributed to market performance or portfolio performance. It’s a crucial step in determining how targets were missed and where your portfolio or market’s strengths and weaknesses are.
To take any analysis further, it gets a lot more complicated. There are so many factors that contribute to ADR, occupancy, and RevPAR that only with careful metric tracking and an experienced hand can true insights be extracted. Many of the various components also have correlations and interactions which influence one another and cause endogeneity. However, if you can deep dive on these components at the smallest level then their impact can be large.

RevPARTY Takes Your RevPAR to the Next Level
RevPARTY, as the name implies, has a strong handle on RevPAR. When you break down expenses to a PAR basis, we know what a normal breakdown looks like because we’ve worked with so many portfolios across so many markets. Not only can we help you with the RevPAR, ADR, and occupancy calculations above, but we can push the analysis further to identify and solve your revenue challenges. Whether you’re a DIY kind of manager and just want some additional information from our Vacation Rental Guides or you want a bespoke engagement/revenue management services, RevPARTY is here to help drive revenue and drive results.